基于OpenCV的基本的图像处理教程
如果您对图像处理不熟悉,可以在阅读卷积神经网络相关内容之前阅读这篇文章。
OpenCV是图像处理库,支持以numpy.ndarray格式加载图像,保存图像以及转换图像颜色格式(RGB,YUV,灰度等)调整大小和其他有用的图像处理功能。
要在Linux或者MacOS上安装opencv,执行如下代码:
git clone https://github.com/opencv/opencv
git clone https://github.com/opencv/opencv_contrib
cd ~/opencv
mkdir build
cd build
cmake -D CMAKE_BUILD_TYPE=RELEASE -D PYTHON3_LIBRARY=/Users/你自己的用户名/anaconda3/lib/libpython3.6m.dylib -D PYTHON3_INCLUDE_DIR=/Users/你自己的用户名/anaconda3/include/python3.6m -D PYTHON_DEFAULT_EXECUTABLE=/Users/你自己的用户名/anaconda3/bin/python3 -D PYTHON_PACKAGES_PATH=/Users/你自己的用户名/anaconda3/lib/python3.6/site-packages -D INSTALL_C_EXAMPLES=OFF -D INSTALL_PYTHON_EXAMPLES=ON -D BUILD_EXAMPLES=ON -D BUILD_opencv_python3=ON -D BUILD_opencv_python2=OFF -D CUDA_GENERATION=Pascal -D OPENCV_EXTRA_MODULES_PATH=~/opencv_contrib/modules ..
在CUDA_GENERATION部分,我假设你装的GPU是Nvidia 的Pascal级别的显卡(譬如,我的就是GTX 1080),其他的配置请自行百度。
make
sudo make install
在build目录下/lib/python3文件夹里面应该有cv2.cpython-36m-darwin.so或者类似的文件,将其改名为cv2.so,并且拷贝到anaconda3/lib/python3.6/site-packages目录中,然后执行python并且输入import cv2,如果一切正常的话,将不会报错,这样你就可以在Python中使用OpenCV扩展了。
import os

import matplotlib.pyplot as plt
import cv2

%matplotlib inline
def readRGBImage(imagepath):
    image = cv2.imread(imagepath)  # Height, Width, Channel
    (major, minor, _) = cv2.__version__.split(".")
    if major == '3':
        # version 3 is used, need to convert
        image = cv2.cvtColor(image, cv2.COLOR_BGR2RGB)
    else:
        # Version 2 is used, not necessary to convert
        pass
    return image
加载并保存图像
cv2.imread用于加载图像。cv2.imwrite用于保存图像。plt.imshow绘图,plt.savefig保存绘图图像。
OpenCV的图像格式通常是3维(如果图像是灰度,则为2维)。第一维是高度,第二维是宽度,第三维是通道(RGB,YUV等)。
要转换颜色格式可以使用cv2.cvtColor。细节写在下一节。
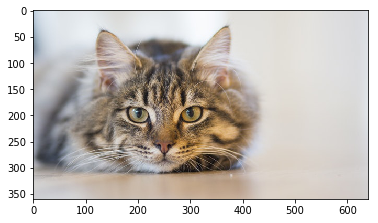
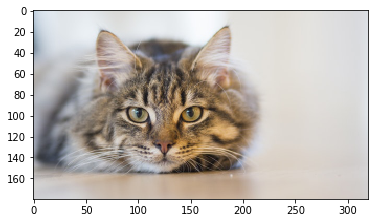
# Read image from file, save image with matplotlib using `imshow` function
basedir = './data/images'
imagepath = os.path.join(basedir, 'sample.jpeg')
#image = cv2.imread(imagepath, cv2.IMREAD_GRAYSCALE)
image = readRGBImage(imagepath)
# Width and Height shows pixel size of this image
# Channel=3 indicates the RGB channel
print('image.shape (Height, Width, Channel) = ', image.shape)
image.shape (Height, Width, Channel) = (360, 640, 3)
cv2.imwrite('out.jpg', image)
True
plt.imshow(image)
plt.savefig('out_plt.png')
更改颜色格式
cv2.cvtColor用于转换颜色格式。请注意,openCV版本3以B,G,R的顺序读取图像颜色。但是,matplotlib处理在R,G,B中的图像颜色。因此,您需要转换颜色顺序,请参阅前面定义的readRGBImage函数。如果图像是灰度图像,则图像是二维数组,第一维是高度,第二维是宽度。
gray_image = cv2.cvtColor(image, cv2.COLOR_RGB2GRAY)

# Gray scale image is 2 dimension, No channel dimension.
print('gray_image.shape (Height, Width) = ', gray_image.shape)
gray_image.shape (Height, Width) = (360, 640)
plt.imshow(gray_image,cmap="gray")
plt.savefig('out_gray_plt.png')
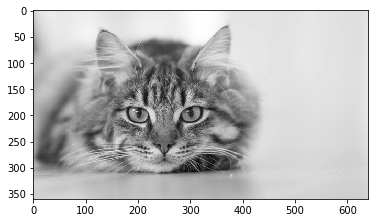
cv2.imwrite('cv_gray.png',gray_image)
True
保存在磁盘上的文件内容如下:
调整图像大小
cv2.imread 调整图像大小。请注意,大小应该按照宽度,高度的顺序来指定。
print('image.shape (Height, Width, Channel) = ', image.shape)
image.shape (Height, Width, Channel) = (360, 640, 3)
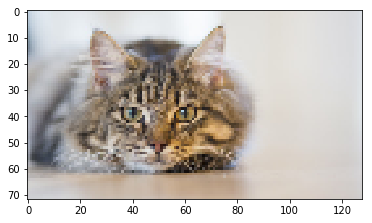
# Resize image to half size
height, width = image.shape[:2]
half_image = cv2.resize(image, (width//2, height//2))  # size must be int
print('half_image.shape (Height, Width, Channel) = ', half_image.shape)
plt.imshow(half_image)
half_image.shape (Height, Width, Channel) =  (180, 320, 3)


<matplotlib.image.AxesImage at 0x13a89d8d0>
plt.savefig('out_half.jpeg')
<matplotlib.figure.Figure at 0x13a85d828>
# Resize image by specifying longer side size
def resize_longedge(image, pixel):
    """Resize the input image

    Longer edge size will be `pixel`, and aspect ratio doesn't change
    """
    height, width = image.shape[:2]
    longer_side = max(height, width)
    ratio = float(pixel) / longer_side
    return cv2.resize(image, None, fx=ratio, fy=ratio)  # size must be int
resized128_image = resize_longedge(image, 128)
print('resized128_image.shape (Height, Width, Channel) = ', resized128_image.shape)
plt.imshow(resized128_image)
resized128_image.shape (Height, Width, Channel) =  (72, 128, 3)


<matplotlib.image.AxesImage at 0x13a85d080>
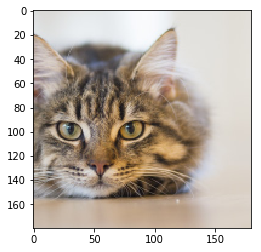
裁剪
numpy切片可以用于裁剪图像。
height, width = half_image.shape[:2]

crop_length = min(height, width)

height_start = (height - crop_length) // 2
width_start = (width - crop_length) // 2

cropped_image = half_image[
                height_start:height_start+crop_length,
                width_start:width_start+crop_length,
                :]
print('cropped_image.shape (Height, Width, Channel) = ', cropped_image.shape)
plt.imshow(cropped_image)
cropped_image.shape (Height, Width, Channel) =  (180, 180, 3)


<matplotlib.image.AxesImage at 0x13a369d30>
基于通道的图像处理
RGB通道操作。理解“通道”的含义在深度学习中很重要。下面的代码提供了一些样例每个通道代表什么。
# Show RGB channel separately in gray scale

fig, axes = plt.subplots(1, 3)

# image[:, :, 0] is R channel.
axes[0].set_title('R channel')
axes[0].imshow(image[:, :, 0], cmap='gray')
# image[:, :, 1] is G channel.
axes[1].set_title('G channel')
axes[1].imshow(image[:, :, 1], cmap='gray')
# image[:, :, 2] is B channel.
axes[2].set_title('B channel')
axes[2].imshow(image[:, :, 2], cmap='gray')
<matplotlib.image.AxesImage at 0x13a2e3b38>
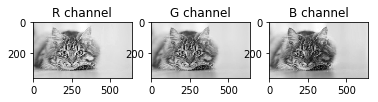
plt.savefig(os.path.join(basedir, 'RGB_gray.jpg'))
<matplotlib.figure.Figure at 0x13a9a17b8>
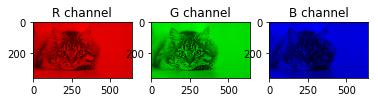
# Show RGB channel separately in color
fig, axes = plt.subplots(1, 3)

# image[:, :, 0] is R channel, replace the rest by 0.
imageR = image.copy()
imageR[:, :, 1:3] = 0
axes[0].set_title('R channel')
axes[0].imshow(imageR)

# image[:, :, 1] is G channel, replace the rest by 0.
imageG = image.copy()
imageG[:, :, [0, 2]] = 0
axes[1].set_title('G channel')
axes[1].imshow(imageG)

# image[:, :, 2] is B channel, replace the rest by 0.
imageB = image.copy()
imageB[:, :, 0:2] = 0
axes[2].set_title('B channel')
axes[2].imshow(imageB)
<matplotlib.image.AxesImage at 0x13aa6e390>